Confusion Matrix
How to determine the predictive capacity of a classification model? We often use the confusion matrix which allows us to compare the results of an algorithm to reality. In this article we will see how to read and build it. To do this, we will run a sentiment analysis model on a sample of 300 emails. Each email will have been analyzed manually beforehand. Each email can be categorized as negative, neutral or positive.
To analyze the results and deduce the accuracy, we will draw a confusion matrix. As a reminder, a confusion matrix is used to evaluate the performance of a learning classification model in AI.
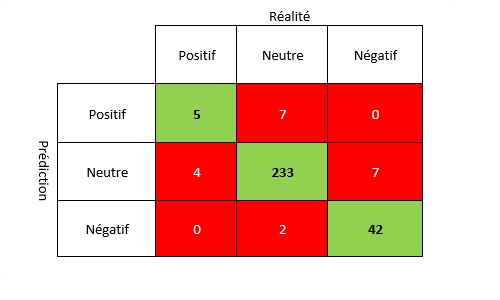
Here is how to read the confusion matrix:
- In green the identical results between reality and prediction (i.e. 5 + 233 + 42 = 280).
- In red, the results that differ between reality and prediction. Here is a reading example:
- There are 4 positive outcomes in reality that were classified as neutral by the model (column 1 row 2).
- There are 0 positive results in reality which have been classified in the negative category by the model (column 1 line 3).
Calculation of the model performance
The overall accuracy of the model is the proportion of correct predictions, i.e. the sum of the number of identical results over the total number of results.

Attention must be paid to the overall precision. The choice of the metric must be made according to the study, i.e. the problem we want to solve, especially when there is a class imbalance problem. The F-Score indicator is often used to determine the performance of a machine learning model. In our case, we can further simplify these calculations because we are mainly interested in detecting negative comments. By doing so, we are left with only two categories (negative and other).

The accuracy here makes it possible to observe out of all the predicted negative comments how many were really negative.

Recall shows the ability of the model to identify all negative comments

Finally, the F-Score, the final indicator that will be used to determine the performance of the model is the harmonic mean of precision and recall.


The performance of the model to identify negative comments is therefore 0.9.